Introduction
Workflow
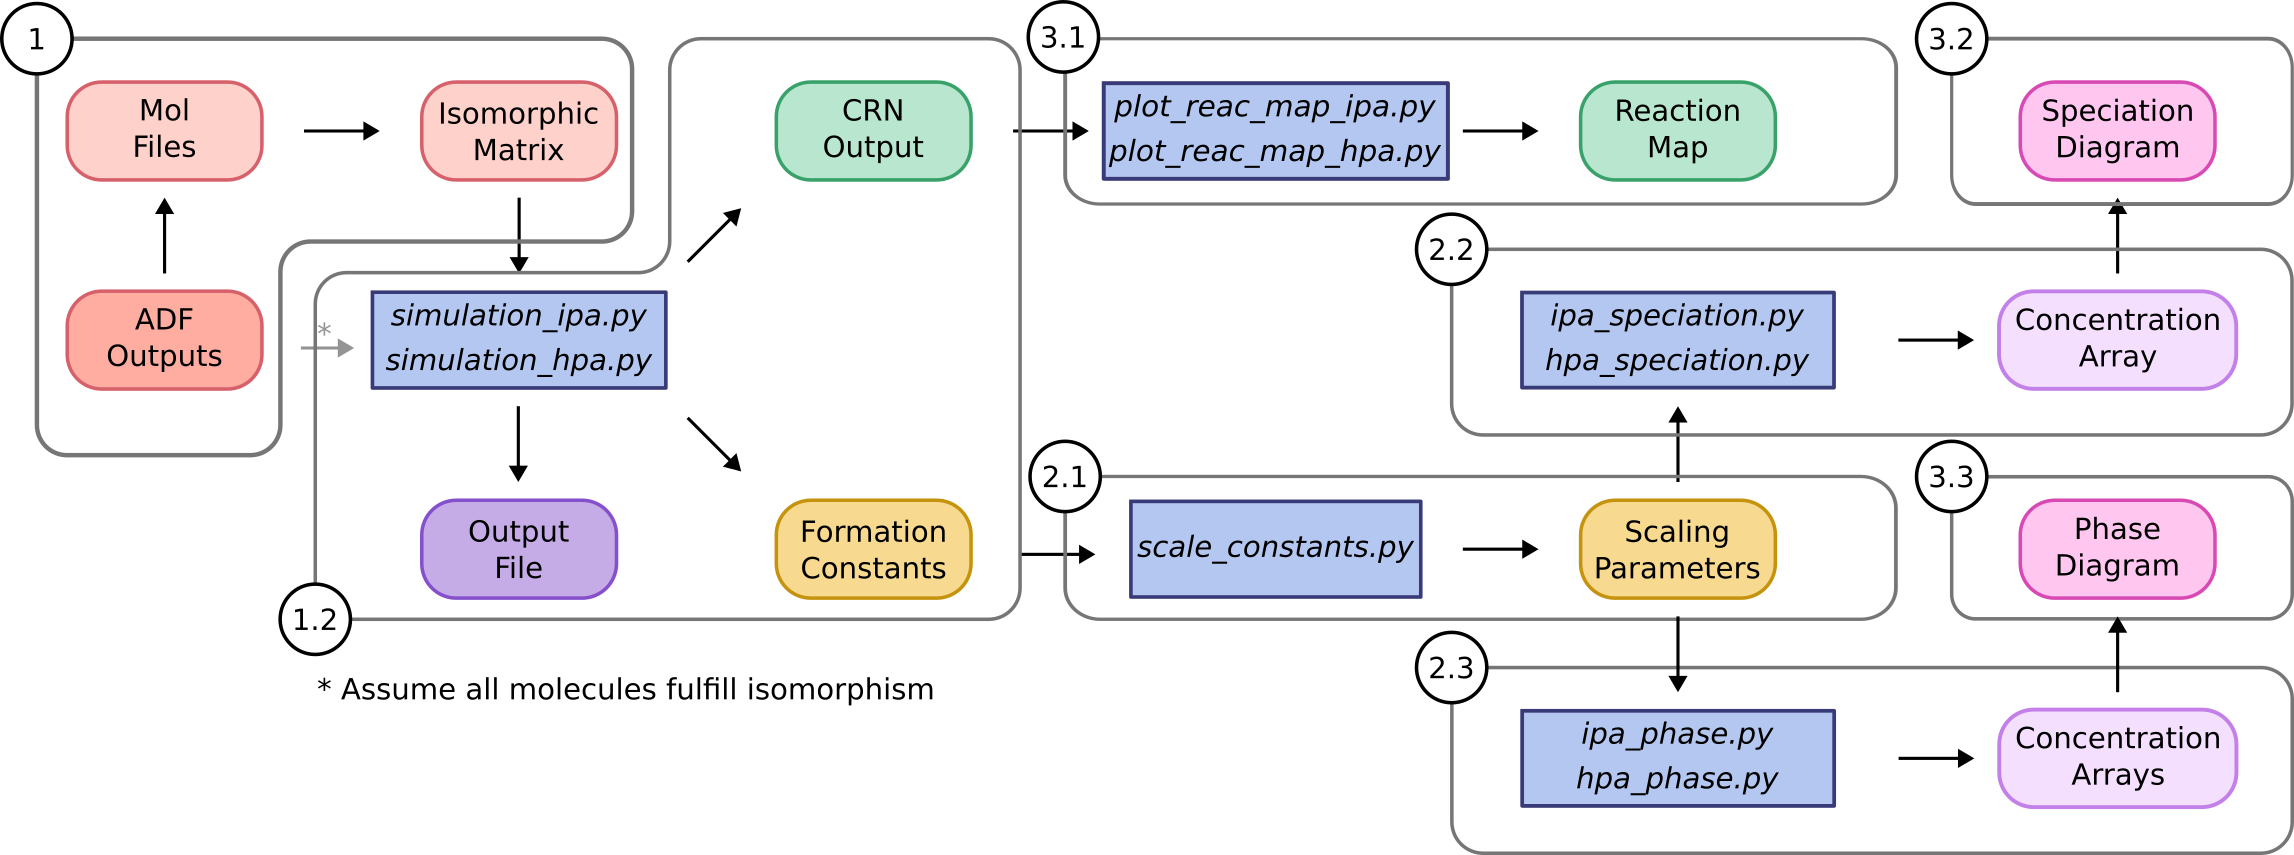
Herein, we describe how the package is organized to aid potential users applying POMSimulator to their own systems. It is worth highlighting that we have designed the code in a modular way, therefore users can easily employ separate parts of the workflow without needing to rewrite the source code. More precisely, the method is divided in three main sections:
1. Simulation: this is the core of POMSimulator methodology as it generates the reaction network and calculates the formation constants for all the metal-oxo clusters considered in the molecular set.
2. Linear scaling: we found that the calculated formation constants were systematically overestimated respect to the experimental ones, thus this part of the method aims at correcting this error.
3. Data interpretation: we provide a set of scripts to represent the formation constants in speciation (and phase) diagrams, as well as the chemical reaction network.
Folder hierarchy
In terms of folder organization, the packages is split in six folders:
The /docs folder contains a markdown manual and the compiled data to build this readthedocs documentation.
The /input folder is where the set of molecules is stored with a directory for each molecular set.
The /output folder stores all files generated by POMSimulator.
The /pomsimulator/modules/ folder contains all the functions that the code uses to either run the simulation or interpret the results: the graph_module, text_module, and msce_module, DataBase, plotting_module and stats_module.
The /simulations folder contains two different model files for running the simulations. The user should modify one of these files to the particular case.
The /utilities folder gathers a set of scripts that are meant for processing and representing the data obtained from the simulations.