Data interpretation
In this section we show the three main scripts in the /utilities folder that can be employed to represent the results generated by POMSimulator.
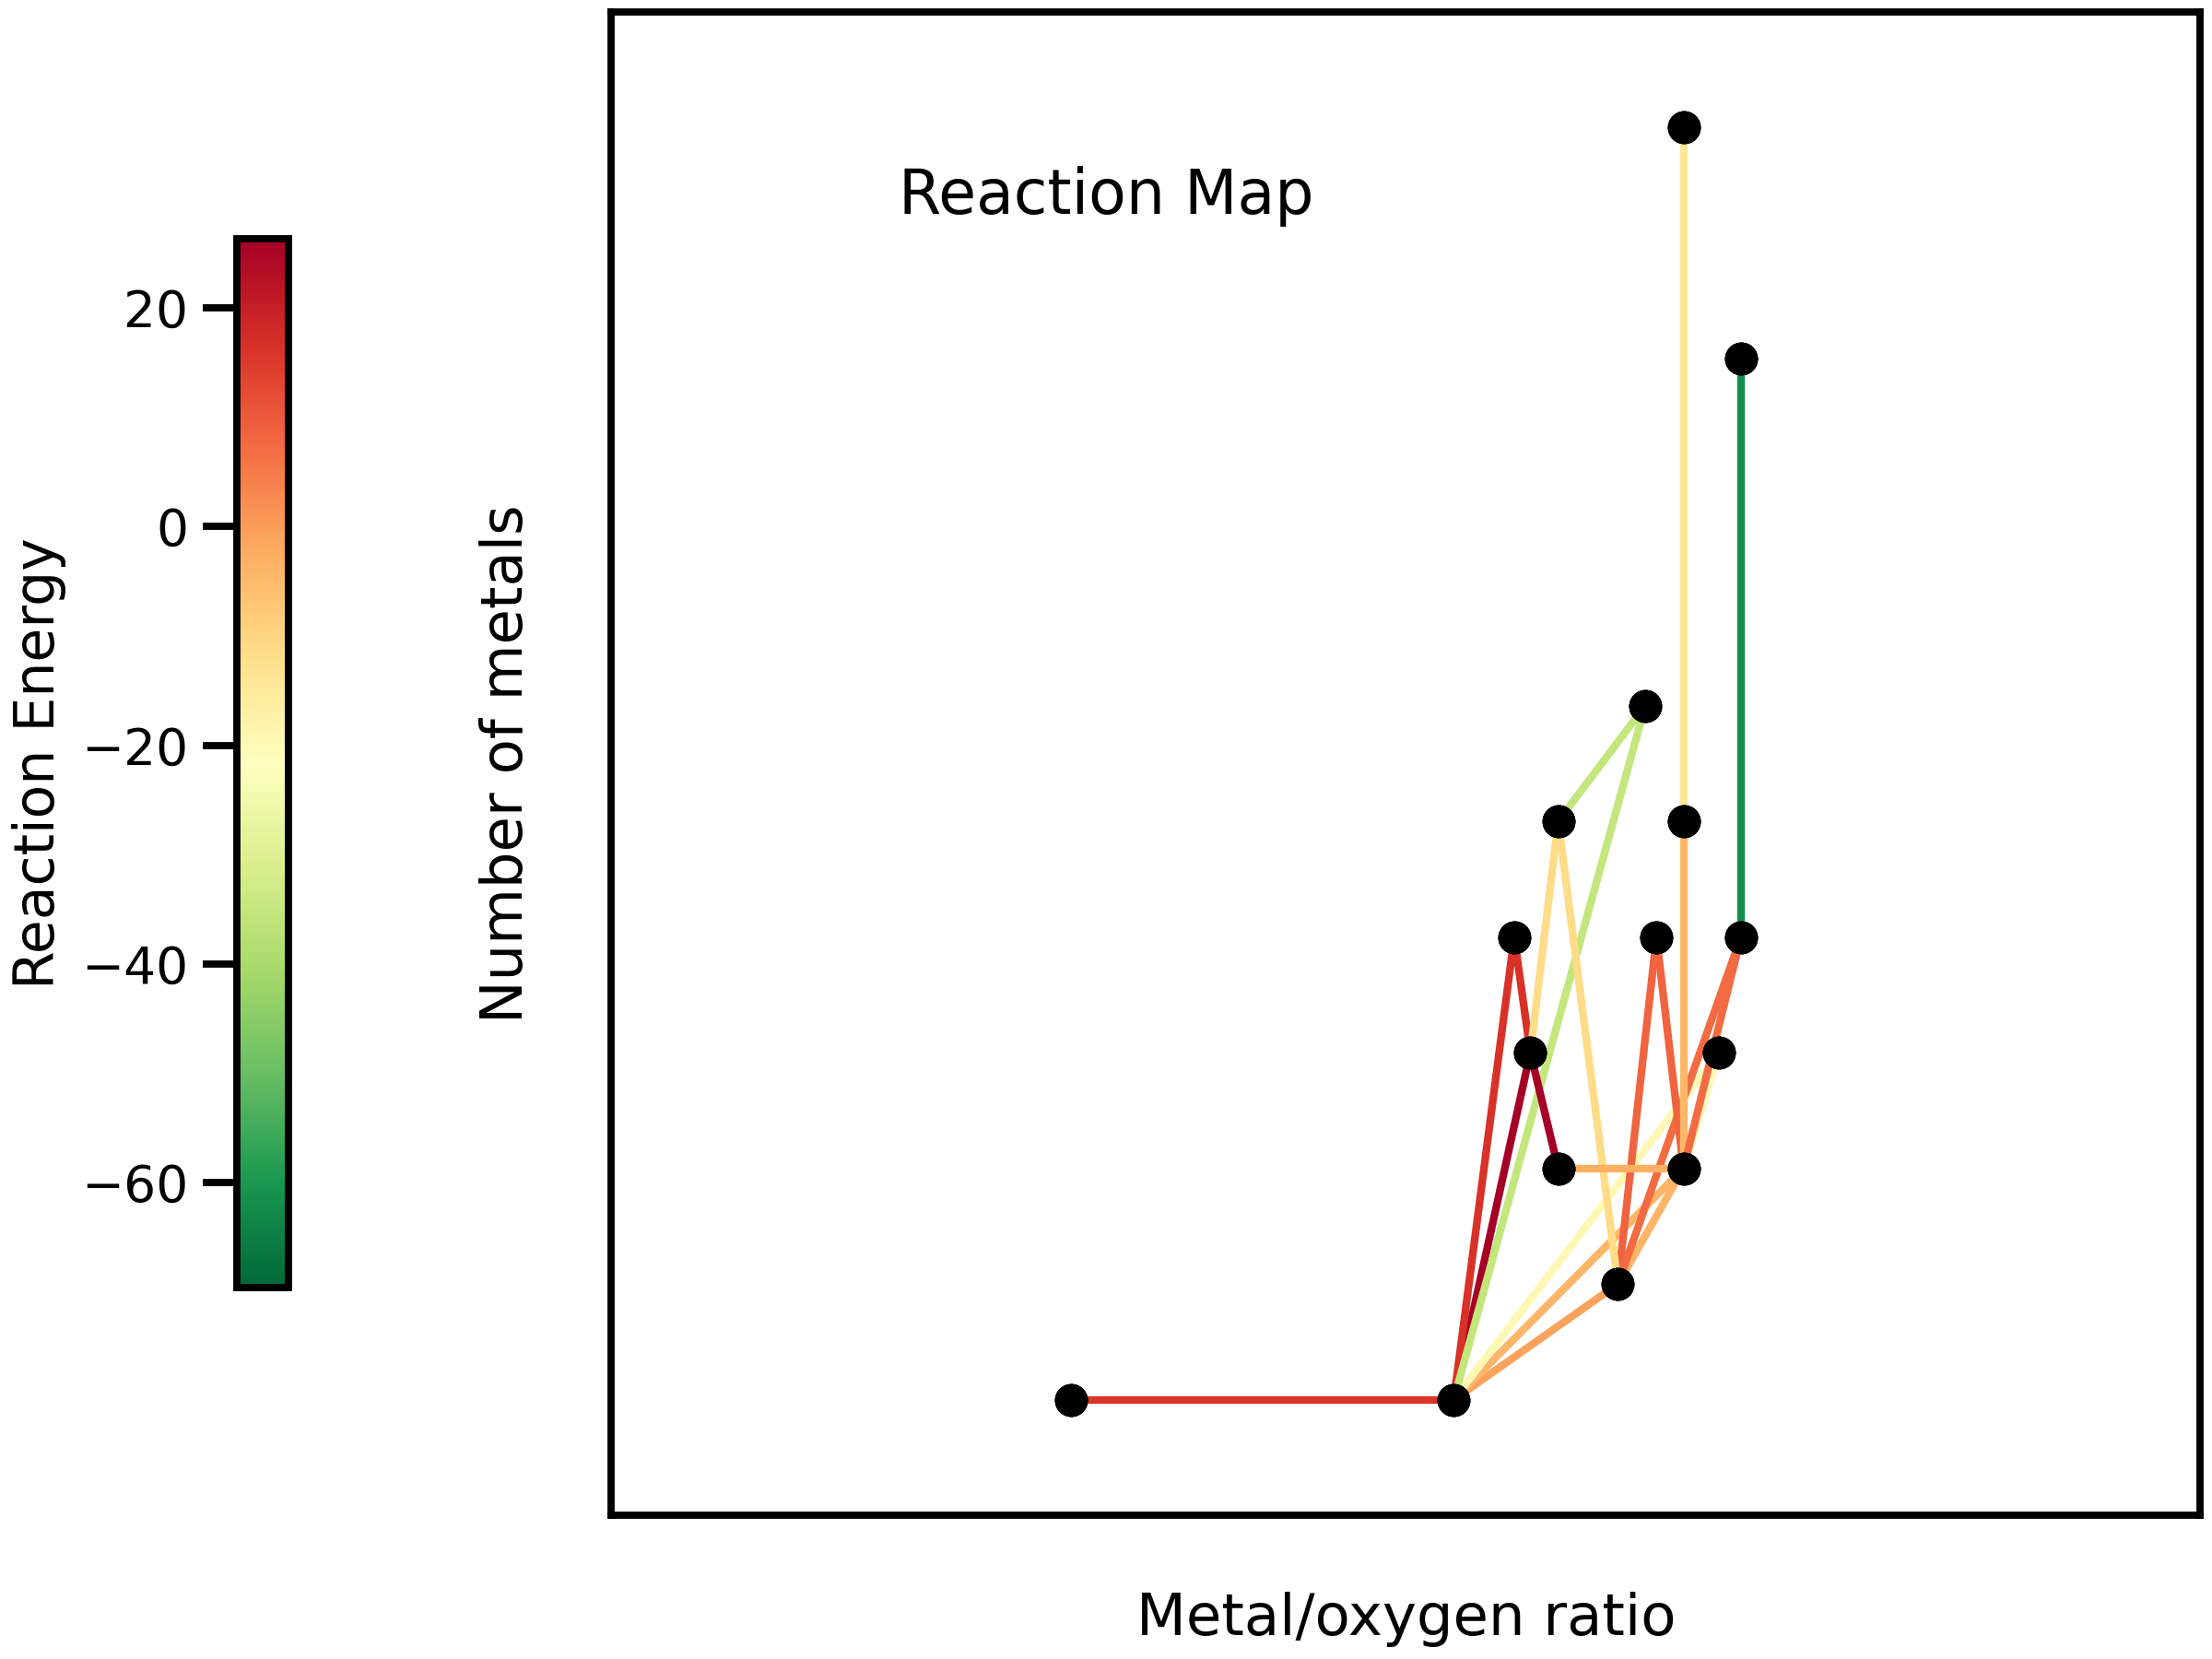
Chemical reaction network
The user can visualize the chemical reaction network in a 2D or 3D map running the plot_reac_map.py file. When the plot function is called, user must choose
between Reaction_Map_2D_monometal or Reaction_Map_3D_monometal. The user also has to choose which reactions are plotted.
If user only selects a single speciation model, the All_models flag must be set to False and
the proper reactions must be passed (idx_new,e_new and type_new). Otherwise, All_models flag
must be set to True and the reactions passed must be Reac_idx,Reac_energy and Reac_type.
To select a particular speciation model, the target_model variable must be changed into the specific model number,
which can be extracted from the scale_constants output file.
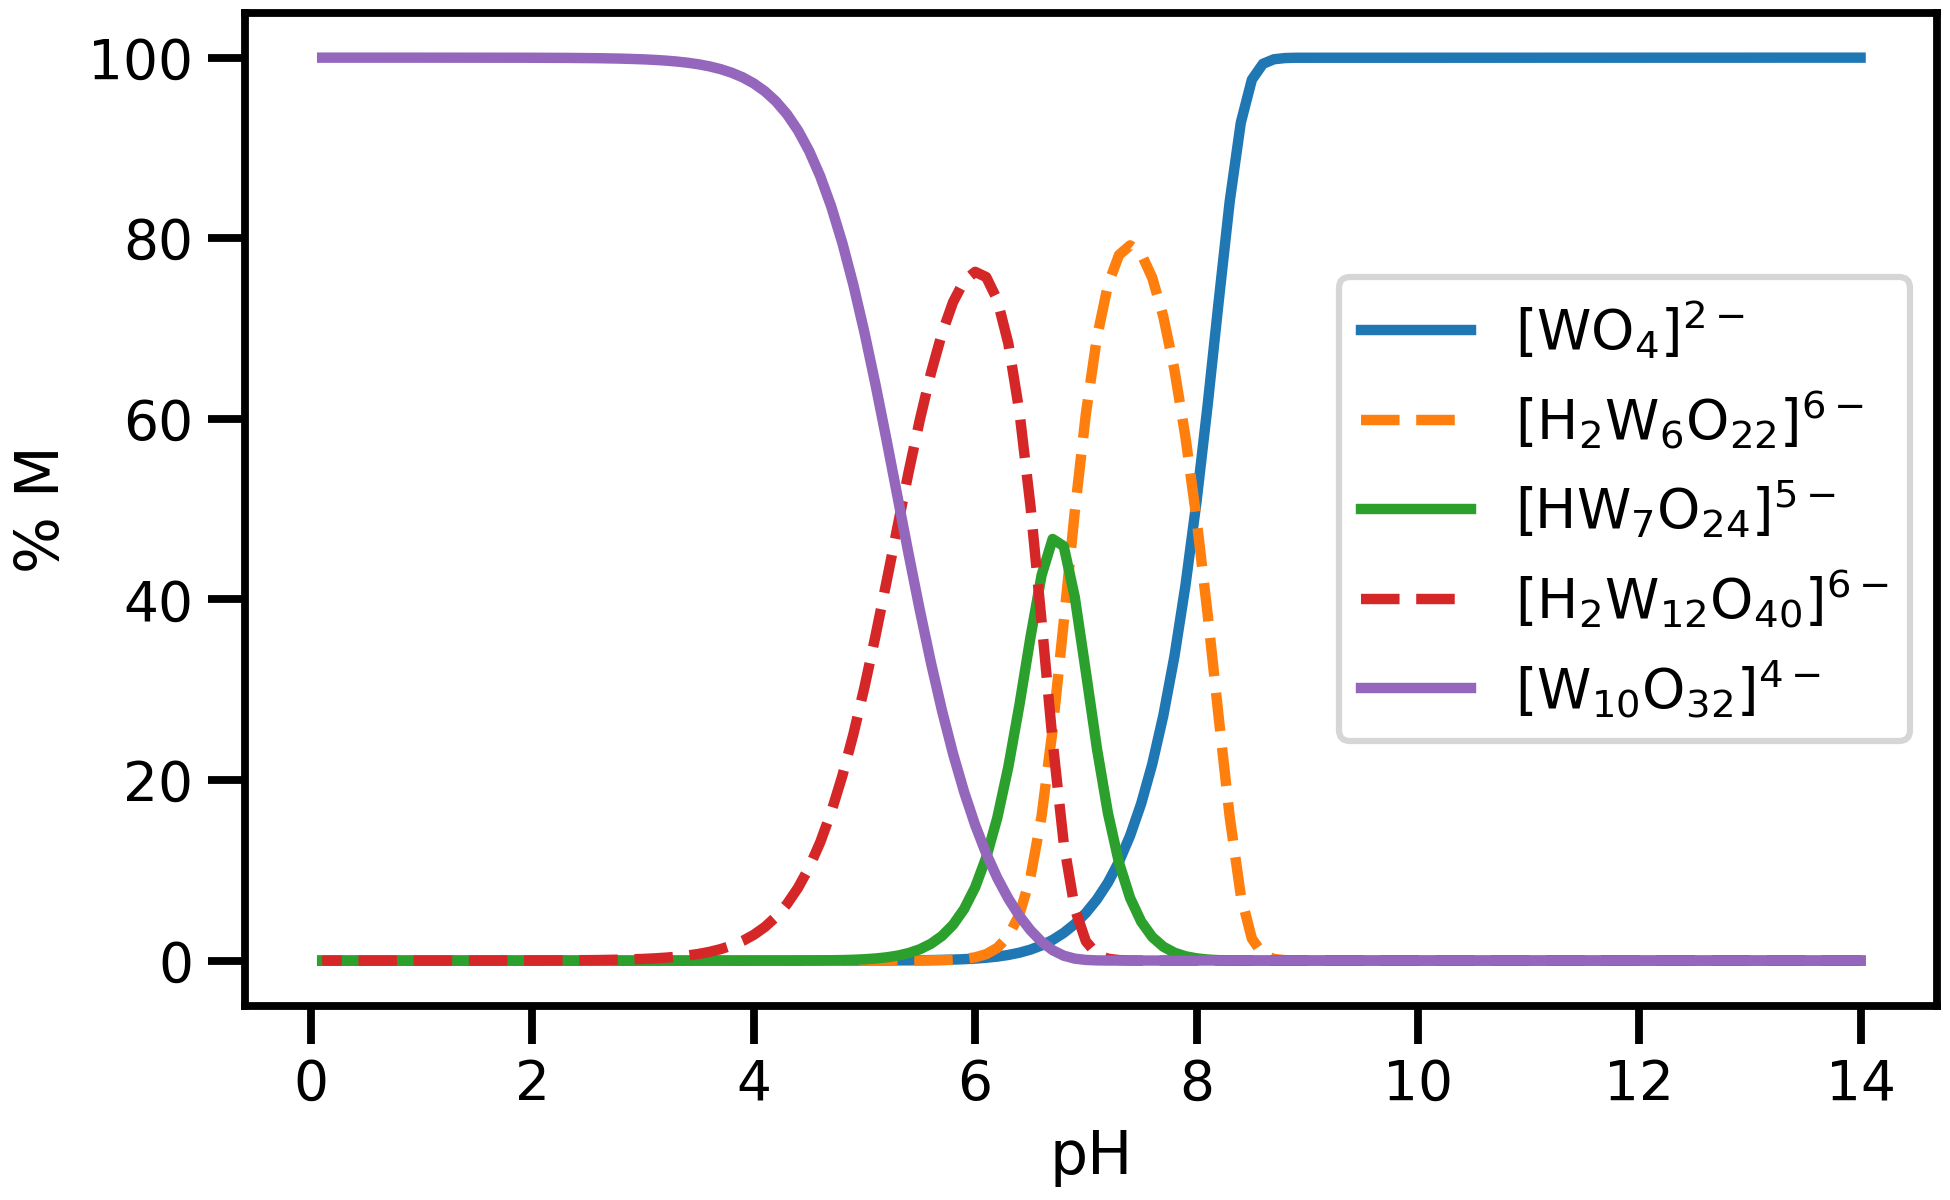
Speciation diagram
plot_speciation_diagram.py. To plot speciation diagrams, only needed the concentration
array calculated in monometal_speciation.py is needed. As a result, a plot like the following one can be obtained running plot_speciation_diagram.py inside /utilities :
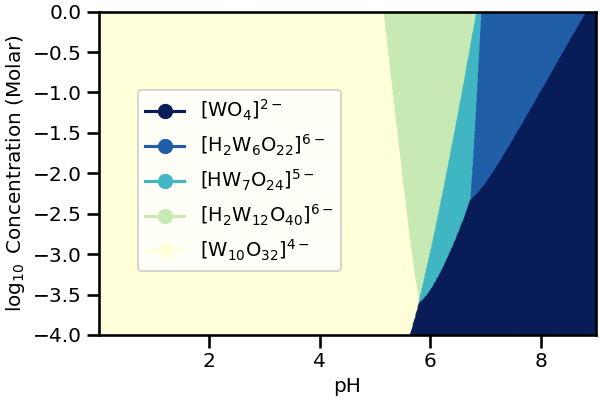
Speciation phase diagram
The user can plot the previously calculated concentrations by running the plot_phase_diagram.py. As in previous section, to plot phase diagrams, only the concentrations array computed at different values of the total concentration, generated by monometal_phase.py is needed.
As a result of running plot_phase_diagram.py inside /utilities, a plot like the following one can be obtained: